
WEST GEORGIA AI SEARCH HABITS | ORIGINAL RESEARCH | 2026
AI vs. Google: How Carroll County, Georgia Residents Search in 2026
Google for the find, AI for the task — what 62 West Georgia residents reveal about the changing local search journey, and why urgency, intent, and industry shape where consumers begin.
Research and analysis by CraigAds · Carrollton, Georgia · July 2026
THE FINDING IN ONE SENTENCE
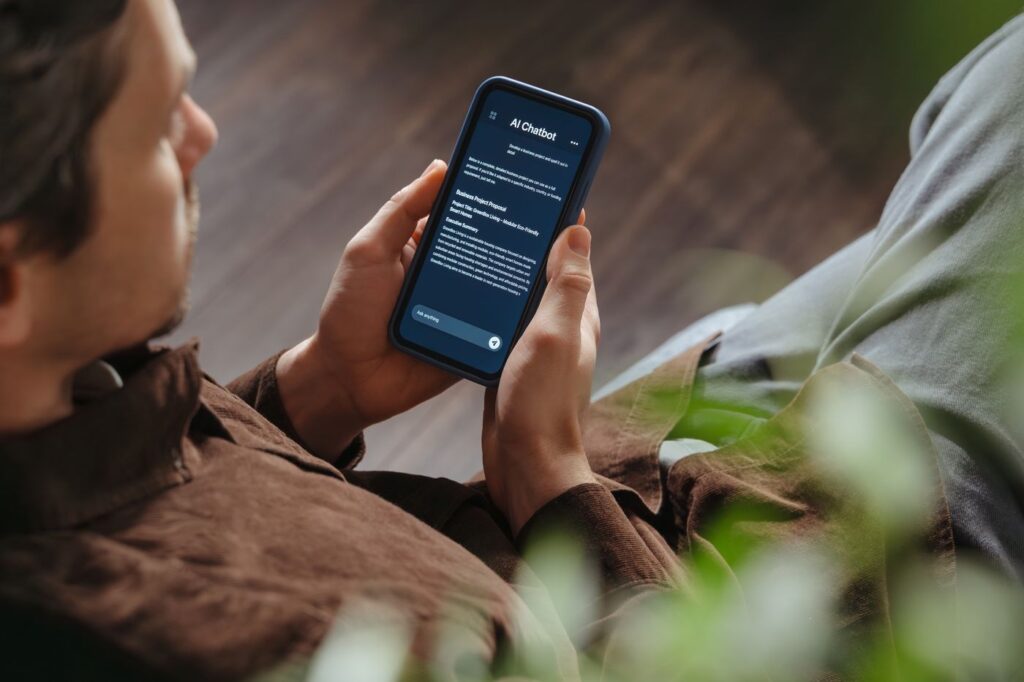
Consumers are not choosing one search tool. They use AI to think through the need and Google to verify, find, and contact a local business.
62
completed surveys, 17+ hours in the field
5,828
local-search answers collected
60%
used AI daily or weekly
82%
preferred mobile search
75%
of direct business choices favored Google
Before You Read This Study: Craig’s Take
Craig, CraigAds — Carrollton, Georgia
Craig, CraigAds — Carrollton, Georgia
Let me tell you why this study exists, because it reveals my agenda, and I’m fine with that.
I run an SEO agency. My clients ask me the same question almost every week: how much should I focus on Google, and how much should I focus on AI? For a long time the industry answered that question with opinions. I wanted to answer it with data. So we went out and got some — 62 people, face to face, right here in West Georgia. Not because face-to-face is some methodological ideal, but because it was practical. Ironically, local folks are more likely to take a survey standing in front of you than sitting at a computer. So that’s what we did.
You’re about to read what we found. Before you do, I want to teach you how to read it — because the numbers will tempt you toward two opposite mistakes, and I’ve watched business owners make both.
Mistake one is thinking AI has already taken over. It hasn’t. Look at the daily AI users in this study — the power users, the people who touch AI every single day. Even they still gave Google the bigger share of their local decisions. Sit with that. The people most immersed in AI still turn to Google when it’s time to find a local business. Google is still number one, and it’s not close.
Mistake two is thinking that means nothing is changing. Going into this, I honestly expected Google to be even more dominant than it turned out to be. The decline is definitive. Both things are true at once — Google is winning, and Google is shrinking — and that combination is exactly what leaves business owners paralyzed. My job in this commentary is to un-paralyze you.
Here’s the framework I want you to carry through the whole study. Google is now also AI — that’s what its June update was about, stitching AI into search so it feels seamless. But notice the ordering. Google is search first, then AI. Every AI engine is AI first, then search. When ChatGPT or Claude needs a local business, it goes and runs a search and pulls in local results anyway. So the real question isn’t Google versus AI. It’s which door people walk through first. And my bet — I’ll say it plainly — is that AI-first will eventually win in the future, because it’s simply more convenient to say “help me solve this” and let something else do the searching. But “eventually” is doing a lot of work in that sentence, and the data in this study tells you what to do today.
One more thing from the field: the resistance. We met it — one respondent flatly told us they loathe AI. My commentary: time is the great equalizer. Professors said the same thing about Wikipedia, and Wikipedia became the place everyone starts before verifying. That’s exactly what AI is — very educated guesses that you verify before you use. A Tesla handles 93% of your driving; the other 7% is still you. People didn’t like the automobile at first either. We’re in one of those times. That negativity fades as the utility becomes irrefutable.
Full disclosure on my own habits, since I’m asking you to trust my read: I’m a skewed result. My daily life is probably 90% AI and 10% Google. But for local? It flips — 90% Google Maps, 10% AI. The agency owner who lives in AI all day still uses Google to find local businesses, because I know how good Google is at differentiating them, and I’m not yet convinced AI can do that at the same level. My own behavior confirms our own study. Make of that what you will. Though here’s the muddy part — when AI needs local results, it often runs a Google or Bing search itself and cites it. At that point it’s always both, and the question gets even harder to answer.
That blurring is already changing what we do for clients. The biggest practical finding we’ve had as an agency: SEO work that serves Bing gets you ranking in Bing, and ranking in Bing makes you eligible to show up in ChatGPT. Our clients are now being found on Google, Bing, and ChatGPT from one broadened strategy. So our advice is this: don’t be too reactive to Google’s quarterly algorithm changes. Keep Google front and center, but loosen your focus a little — a more flexible SEO strategy is what the next few years require. And know that the distinction between SEO, AEO, and GEO is much more a marketing difference between companies than a practical difference in what you actually do on a website. Google has said essentially the same thing.
Two predictions, on the record, so you can grade me later. First: we’ll run this study again in 2027, ’28, and ’29, and I predict Google’s share of these decisions drops from about two-thirds to around 57%, with AI-plus-mixed climbing past thirty. Whether that bucket stays hybrid or goes pure AI is the open question. Second, the longer arc: Yahoo was once the number one search engine. Something similar is coming in the race between ChatGPT, Gemini, and Claude — one of them becomes our next Google. That’s our prediction. We can’t know for sure. That’s why we plan to re-run the study annually.
One last thing before you dig in. We asked people if they own a Tesla, and you’ll wonder why. Partly offhand — but Tesla is AI in the physical world, and that’s the paradigm coming next, in years or maybe months. A robot that cleans your house and catalogs your things. Grok talking to you while the car drives. I personally find voice AI the most helpful tool there is, even though it isn’t seamless yet — voice versions still have real limitations, especially around search. But whoever makes voice seamless — Apple, Google, Anthropic, Microsoft, doesn’t matter who — wins. Whoever innovates on this the most is predicted to win the AI race because the convenience is the differentiator. The endgame is that we never type a search again. You’ll just say: help me solve this. And when it’s time for a Google search, the AI will run it for you (on top of everything else in your life).
For today, though, the data is clear, so let me say it plainly: Google is still number one. Focus primarily on what Google has to say about SEO for today — and know that tomorrow could be a more AI-focused future.
Search now has more than one path
A homeowner with water spreading across the floor is likely to open Google, scan local plumbers, check availability and call. A person comparing skincare products or hair services has more time to describe preferences, ask follow-up questions, and refine the answer through AI.

That contrast is a useful example, not the whole story. The CraigAds West Georgia AI Search Habits Survey found a broader two-tool habit: urgency and local action still push consumers toward Google, while advice, personalization, and deliberation create more room for AI. The shift is not unique to West Georgia: a national study reported by Search Engine Land found that 37% of consumers now start some searches with AI instead of Google.
What the study measured

The survey collected 62 completed responses over approximately 17 hours across three days in July 2026. Participants were recruited in downtown Carrollton, near the University of West Georgia and at nearby businesses. Each completed a roughly 10-minute questionnaire and received a $5 cash incentive.
The questionnaire measured AI frequency, device use, trust, and task preferences. It also presented 47 problem-shaped situations and the same 47 needs as direct business categories. Together, those grids produced 5,828 local-search answers.
This was a convenience sample, not a population estimate. Half of respondents were ages 20–24, no participant was 65 or older, and the long grid encouraged some respondents to repeat the same answer. The precise category percentages should therefore be read directionally; the strongest value is in the repeated patterns.
Where 5,828 local-search answers went
AI is already routine for many respondents
Fifty-three respondents (85.5%) reported at least some AI use. Thirty-seven (59.7%) used it daily or a few times a week, while nine did not use AI at all. AI was no longer described as a novelty; participants discussed it as part of school, work, organization, planning and creative tasks. That tracks the national picture: Pew Research Center’s Americans and AI 2026 study found that about half of U.S. adults now use AI chatbots, with roughly a quarter using them daily.
How often respondents use AI tools
Habit matters more than simple familiarity
Daily users behaved differently from everyone else. Among the 14 daily AI users, 33.2% of local decisions went to AI, and 47.0% went to Google. Among weekly, occasional, and non-users combined, only 5.9% went to AI while 72.2% went to Google. The practical dividing line was not whether someone had tried AI; it was whether AI had become a daily habit.
Daily AI habit changes where local decisions go
Most people are building a two-tool habit
For quick answers, 28 respondents selected both Google and AI, 27 selected Google and only seven selected AI alone. That near tie between combined use and Google-only use is one of the clearest signs of change. AI influence is larger than the AI-only category suggests because many people added it without abandoning Google. National data points the same direction: Gartner’s January 2026 consumer survey found only about one-third of consumers say generative AI rivals search engines — and advised marketers to optimize for both AI-driven and traditional search.
For quick answers, which do you prefer?
Google and AI are being assigned different jobs
The task results show why the two tools coexist. Google led for general questions, research, comparing products or services, health and wellness questions and local business recommendations. AI led for writing or editing and creative ideas. Work-related tasks were tied, and trip planning was close.
What each tool gets used for (multiple selections allowed)
Top Google tasks
Top AI tasks
The simple version: “find it” versus “help me do it”

Participants repeatedly described Google as the place for business hours, phone numbers, directions, quick facts and local options. AI was the place for explanations, drafts, comparisons, brainstorming and personalized guidance.
One respondent described the difference with a history example: Google works when the question is who served as president in a certain year; ChatGPT is more useful when the person wants the background and significance. Business owners described a similar split, using AI to organize inventory, plan a week, draft emails or write Instagram captions rather than to replace Google Maps.
The reasons respondents chose AI fit that role. They valued faster answers, more detail, follow-up questions, personalization and less scrolling. The appeal is not only the answer, it is the ability to keep the conversation moving.
The wording of the need changes the answer
The survey asked the same local decision in two ways. First, it described a situation, such as a leaking roof or a garage floor upgrade. Then it asked about the direct business category, such as a roofing company or garage floor coating company.
Across the problem-shaped questions, 58.1% of answers favored Google, 14.4% favored AI, and 27.5% were a toss-up or neither. When the wording shifted to a business category, Google rose to 74.9% while AI fell to 9.8%.
The wording of the need changes the answer
Problem-shaped wording (“Your roof is leaking…”)
Business-category wording (“Roofing company”)
The hire still tends to happen on Google
A consumer may ask AI why an appliance failed, what questions to ask a roofer, or which coating system is best. But when the prompt becomes “find a company,” Google, Maps, reviews, and direct contact information regain the advantage. AI is most visible earlier in the journey; Google remains the strongest bridge to local action. Gartner observed the same division nationally: consumers welcome AI’s help while shopping but stop short of letting it make the purchase decision.
This also explains why the article is not simply about Google versus ChatGPT. The more important issue is stage and intent. A single customer can use both tools within the same decision, and may move back and forth before calling.
Beauty and plumbing make the contrast easy to see
When respondents imagined needing hair, skincare or beauty services, 24.2% said AI could fully or somewhat help. For a clogged toilet, broken pipe or plumbing issue, only 6.5% selected AI. AI entered the beauty decision nearly four times as often as the plumbing emergency.
Beauty vs. plumbing: deliberation invites AI, urgency goes to Google
Hair, skincare, or beauty services — AI 24.2%
Clogged toilet / plumbing issue — AI 6.5%
Why beauty invites conversation

Beauty decisions are often personal, descriptive and open-ended: Which products fit my skin type? What routine can I add without changing everything at once? AI can remember the details, ask follow-up questions and compare options. That makes it useful during research and preference-building.
Plumbing compresses the decision. A burst pipe creates immediate risk, a geographic limit and a need for someone who can answer the phone now. AI may explain how to shut off the water, but it does not replace the map, reviews, availability and click-to-call experience.
Google still closes the beauty appointment
The beauty result does not mean consumers have stopped using Google to find salons or med spas. Once the question became a direct provider search, 77.4% selected Google for both categories. AI can define the desired look or service; Google remains stronger for local proof, availability, and contact.
Beauty: AI defines the need, Google closes the appointment
Urgency goes to Google; deliberation invites AI
Sorting the scenarios by AI share reveals the larger logic. Hair and beauty, financial planning, appliance troubleshooting, Botox or fillers, and legal questions appeared near the top. A clogged toilet or broken pipe appeared at the bottom. Roof leaks also remained Google-heavy because the need is local and time-sensitive.
Where AI shows up most — and least — across 47 local scenarios
Most AI involvement
Least AI involvement
Where garage floor coating fits
Garage floor coating sits in the deliberate middle. When the need was framed as an upgrade project, 17.7% selected AI, well above the plumbing emergency. A coating project gives the consumer time to compare epoxy and polyaspartic systems, colors, preparation, warranties, pricing, and long-term durability.
When the wording became “garage floor coating company,” AI fell to 9.7%, and Google rose to 74.2%. The implication is practical: detailed content can influence the research phase, while Google visibility remains critical when the homeowner is ready to compare companies and call.
The conversations explained what the grid could not
Participants often kept talking after the survey. Business owners described AI as an assistant for inventory, schedules, emails, captions and documents. Students discussed study guides and practice questions, while parents worried that children could become dependent on AI and lose independent thinking skills.
Creative uses produced both excitement and frustration. A former musician described using AI to build a full-band sound around a guitar part, but he disliked seeing fully AI-generated music compete with human artists. Several participants also said AI had become dramatically more useful within the past year. One realized during the survey that they used it more often than they had thought.
Mobile is the common ground
Fifty-one respondents (82.3%) preferred searching on a mobile device. Whatever combination of Google and AI a customer uses, the journey usually lands on a small screen.
Preferred method of searching
What local businesses should do
For home service businesses weighing AI vs Google, the data says the answer is both — weighted heavily toward Google today. In practice:
- Protect the Google foundation. Keep hours, phone numbers, categories, service areas, photos, reviews and links accurate.
- Answer the questions before the provider search. Publish clear pages about problems, options, costs, comparisons, timelines and next steps.
- Match the content to the decision. Considered services benefit from depth and personalization; emergency services should prioritize speed, location and availability.
- Use real proof. Local photos, recent reviews, credentials and specific examples help both people and systems evaluate the business.
- Measure the whole journey. A customer may begin in AI, verify in Google and convert from a map listing or phone call.
The bottom line
AI has not replaced Google in West Georgia local search. It has changed the route. Google remains the dominant discovery and action engine for local providers, while AI is becoming the conversational layer used to explain, compare, write, organize and decide what to do next.
Now, some professor’s commentary on the results themselves — this is Craig speaking.
The beauty-versus-plumbing gap surprised me more than anything else in this study, and then hindsight made it obvious. A burst pipe is not a conversation — you need a human with a wrench, now, and Google gets you one. But the decisions that are personal, detailed, and full of comparisons are exactly where AI shines and where a traditional Google search is honestly clumsy. The amount of comparing and contrasting happening inside AI conversations right now is remarkable. That is why we looked at the whole ladder — beauty at the top, garage floor coating in the deliberate middle, plumbing at the bottom. So here is the question these results should leave you asking: where does your business sit on that ladder?
And the thing that impressed me most never shows up in the percentages: the business owners. Standing there for three days, I was struck by how many owners were already using AI to run their operations — inventory, scheduling, emails, marketing — compared to the everyday casual user. That adoption gap between owners and consumers was one of the clearest things we saw in person, and it tells you where this is headed. The owners are not waiting.
For local businesses, the answer is not to choose one platform. It is to remain easy to find on Google and easy to understand wherever an AI system may summarize or compare the business. Accurate information, useful answers and real proof support both sides of the journey.
Limits and what to watch next
The findings are descriptive and local. The young age skew, in-person convenience sample, absence of respondents 65 and older, and repeated-answer effect limit generalization. The survey measured stated preferences rather than observed search sessions, so it cannot always show which platform came first.
A shorter annual survey could turn this study into a useful baseline. Future research should recruit more older adults and business owners, track the order in which people move between tools, and test whether the beauty-versus-plumbing gap persists as AI becomes more integrated into Google itself. Pew Research Center has already documented one such effect nationally: Google users click fewer links when an AI summary appears in the results.
References
CraigAds. (2026). West Georgia AI search habits survey [Unpublished data set]. Full results in the appendix above.
Gartner. (2026a, January 20). Gartner survey finds only one-third of consumers say GenAI rivals search engines; marketers must optimize for both AI-driven and traditional search.
Gartner. (2026b, May 27). Gartner survey finds consumers want AI shopping help, but not AI purchase decisions.
Pew Research Center. (2025, July 22). Google users are less likely to click on links when an AI summary appears in the results.
Pew Research Center. (2026, June 17). Americans and AI 2026: Chatbots, smart devices and views on impact.
Search Engine Land. (2026, January 7). 37% of consumers start searches with AI instead of Google.
Appendix: Full Survey Results
CraigAds West Georgia AI Search Habits Survey — July 2026. All 62 completed responses, every question. Percentages are of 62 respondents unless noted and may not total 100 because of rounding. Respondent names are withheld per the survey consent terms. The full AI search statistics from the 2026 survey follow.
Part 1. Who responded
| Response | % of 62 |
|---|---|
| 20-24 | 50.0% |
| 25-34 | 17.7% |
| 35-44 | 6.5% |
| 45-54 | 17.7% |
| 55-64 | 8.1% |
| Response | % of 62 |
|---|---|
| 30117 | 54.8% |
| 30116 | 11.3% |
| 30110 | 6.5% |
| 30170 | 3.2% |
| All other ZIP codes (one each) | 24.0% |
30117 and 30116 are Carrollton; 30110 is Bowdon; 30170 is Roopville.
| Response | % of 62 |
|---|---|
| Employed (various fields) | 83.9% |
| Business owner / self-employed | 8.1% |
| Student | 4.8% |
| Retired | 3.2% |
Open-ended; grouped into categories.
| Response | % of 62 |
|---|---|
| Under $25,000 | 21.0% |
| $25,000–$49,999 | 16.1% |
| $50,000–$74,999 | 24.2% |
| $75,000–$99,999 | 12.9% |
| $100,000–$149,999 | 12.9% |
| $150,000+ | 12.9% |
| Response | % of 62 |
|---|---|
| Yes | 3.2% |
| No | 96.8% |
Part 2. AI and search habits
| Response | % of 62 |
|---|---|
| 1 | 14.5% |
| 2 | 12.9% |
| 3 | 33.9% |
| 4 | 12.9% |
| 5 | 25.8% |
| Response | % of 62 |
|---|---|
| Daily | 22.6% |
| A few times a week | 37.1% |
| A few times a month | 12.9% |
| Rarely | 12.9% |
| I do not use AI tools | 14.5% |
| Response | % of 62 |
|---|---|
| Mobile device | 82.3% |
| Desktop computer | 12.9% |
| Both / other | 4.8% |
| Response | % of 62 |
|---|---|
| Mobile device | 66.1% |
| Desktop computer | 21.0% |
| Neither / do not use | 9.7% |
| Both / other | 3.2% |
| Response | % of 62 |
|---|---|
| Mobile device | 75.8% |
| Desktop computer | 21.0% |
| Both / other | 3.2% |
Part 3. What each tool is used for
| Response | % of 62 |
|---|---|
| Nothing / do not use | 21.0% |
| Design, images & creative | 17.7% |
| Business & work tasks | 16.1% |
| Writing & documents | 14.5% |
| Quick answers & questions | 12.9% |
| School & studying | 9.7% |
| Planning & lifestyle | 4.8% |
| Health questions | 3.2% |
Open-ended question; responses grouped into themes.
| Response | % of 62 |
|---|---|
| General information & quick answers | 32.3% |
| School & research | 30.6% |
| Finding businesses & shopping | 16.1% |
| Health questions | 8.1% |
| How-to & learning | 6.5% |
| Work resources | 4.8% |
| Navigation | 1.6% |
Open-ended question; responses grouped into themes.
| Response | % of 62 |
|---|---|
| Asking general questions | 62.9% |
| Research | 41.9% |
| Creative ideas | 35.5% |
| Planning trips or activities | 35.5% |
| Work-related tasks | 33.9% |
| Writing or editing | 32.3% |
| Comparing products or services | 30.6% |
| Schoolwork or studying | 29.0% |
| Health or wellness questions | 29.0% |
| Local business/service recommendations | 21.0% |
| None / other | 11.3% |
Percentages are of all 62 respondents; multiple selections were allowed, so totals exceed 100%.
| Response | % of 62 |
|---|---|
| Asking general questions | 82.3% |
| Research | 59.7% |
| Local business/service recommendations | 45.2% |
| Comparing products or services | 43.5% |
| Schoolwork or studying | 38.7% |
| Planning trips or activities | 38.7% |
| Health or wellness questions | 37.1% |
| Work-related tasks | 33.9% |
| Writing or editing | 25.8% |
| Creative ideas | 12.9% |
| None / other | 1.6% |
Percentages are of all 62 respondents; multiple selections were allowed, so totals exceed 100%.
Part 4. Preference and trust
| Response | % of 62 |
|---|---|
| 43.5% | |
| AI tools | 11.3% |
| I use both | 45.2% |
| Response | % of 62 |
|---|---|
| Very likely | 29.0% |
| Somewhat likely | 27.4% |
| Neutral | 27.4% |
| Unlikely | 8.1% |
| Very unlikely | 8.1% |
| Response | % of 62 |
|---|---|
| Faster answers | 43.5% |
| More detailed answers | 38.7% |
| Ability to ask follow-up questions | 30.6% |
| More unique or personalized answers | 27.4% |
| I do not choose AI over Google | 25.8% |
| Less scrolling/searching | 25.8% |
| Easier-to-understand answers | 19.4% |
| Better for comparing options | 11.3% |
| Fewer ads | 9.7% |
| Better for solving a specific problem | 6.5% |
Percentages are of all 62 respondents; multiple selections were allowed, so totals exceed 100%.
| Response | % of 62 |
|---|---|
| Faster answers | 30.6% |
| Better for solving a specific problem | 24.2% |
| Better for comparing options | 22.6% |
| I do not choose AI over Google | 21.0% |
| More detailed answers | 19.4% |
| Ability to ask follow-up questions | 17.7% |
| Fewer ads | 14.5% |
| Easier-to-understand answers | 14.5% |
| More unique or personalized answers | 12.9% |
| Less scrolling/searching | 9.7% |
| None / other | 3.2% |
Percentages are of all 62 respondents; multiple selections were allowed, so totals exceed 100%.
Part 5. The 47 problem scenarios
Q19. “Choose the scenario most likely for you…” Each of 47 situations was answered by all 62 respondents (2,914 answers). Sorted from most AI-leaning to least. “Google total” and “AI total” combine fully and somewhat responses.
| Item | Share of answers | Fully Google | Somewhat Google | Tossup | Somewhat AI | Fully AI | Google total | AI total |
|---|---|---|---|---|---|---|---|---|
| You need hair, skincare, or beauty services. | 33.9% | 16.1% | 25.8% | 9.7% | 14.5% | 50.0% | 24.2% | |
| You need help with financial planning or investment advice. | 37.1% | 17.7% | 21.0% | 9.7% | 14.5% | 54.8% | 24.2% | |
| One of your appliances stops working. | 37.1% | 17.7% | 22.6% | 8.1% | 14.5% | 54.8% | 22.6% | |
| You are interested in Botox or fillers. | 37.1% | 12.9% | 29.0% | 8.1% | 12.9% | 50.0% | 21.0% | |
| You have a legal issue. | 40.3% | 9.7% | 29.0% | 6.5% | 14.5% | 50.0% | 21.0% | |
| You are worried there may be mold in your home or business. | 29.0% | 22.6% | 29.0% | 9.7% | 9.7% | 51.6% | 19.4% | |
| You need a teeth cleaning or have a dental issue. | 41.9% | 14.5% | 24.2% | 6.5% | 12.9% | 56.5% | 19.4% | |
| You are planning a wedding or event. | 35.5% | 17.7% | 27.4% | 8.1% | 11.3% | 53.2% | 19.4% | |
| You have back, neck, or joint pain. | 37.1% | 17.7% | 25.8% | 8.1% | 11.3% | 54.8% | 19.4% | |
| Your pet is sick. | 38.7% | 12.9% | 29.0% | 6.5% | 12.9% | 51.6% | 19.4% | |
| You want to upgrade your garage floor with epoxy or a durable coating. | 38.7% | 16.1% | 27.4% | 3.2% | 14.5% | 54.8% | 17.7% | |
| Your garage or closet is cluttered. | 30.6% | 12.9% | 38.7% | 6.5% | 11.3% | 43.5% | 17.7% | |
| You need help with taxes, bookkeeping, or accounting. | 33.9% | 22.6% | 25.8% | 3.2% | 14.5% | 56.5% | 17.7% | |
| You have an electrical issue or need new lighting, outlets, or wiring. | 33.9% | 21.0% | 27.4% | 8.1% | 9.7% | 54.8% | 17.7% | |
| You need a concrete patio, driveway, slab, or repair. | 33.9% | 21.0% | 27.4% | 8.1% | 9.7% | 54.8% | 17.7% | |
| Your air conditioning or heating stops working. | 43.5% | 14.5% | 25.8% | 8.1% | 8.1% | 58.1% | 16.1% | |
| You are locked out or need a lock repaired or replaced. | 40.3% | 21.0% | 22.6% | 6.5% | 9.7% | 61.3% | 16.1% | |
| You need car, home, life, or business insurance. | 38.7% | 19.4% | 25.8% | 6.5% | 9.7% | 58.1% | 16.1% | |
| You're planning a funeral or memorial service. | 40.3% | 12.9% | 30.6% | 3.2% | 12.9% | 53.2% | 16.1% | |
| You need grading, drainage, or site work done. | 30.6% | 27.4% | 27.4% | 6.5% | 8.1% | 58.1% | 14.5% | |
| You need coatings, materials, or industrial products. | 33.9% | 27.4% | 24.2% | 4.8% | 9.7% | 61.3% | 14.5% | |
| You want to install or repair a fence. | 32.3% | 25.8% | 27.4% | 4.8% | 9.7% | 58.1% | 14.5% | |
| You need interior or exterior painting for your home or business. | 38.7% | 21.0% | 27.4% | 4.8% | 8.1% | 59.7% | 12.9% | |
| Your office or commercial building needs professional cleaning. | 35.5% | 19.4% | 32.3% | 4.8% | 8.1% | 54.8% | 12.9% | |
| You have pests in your home. | 38.7% | 25.8% | 22.6% | 6.5% | 6.5% | 64.5% | 12.9% | |
| Your garage door will not open or needs repair. | 37.1% | 24.2% | 25.8% | 6.5% | 6.5% | 61.3% | 12.9% | |
| Your gutters are clogged, leaking, or need replacement. | 37.1% | 24.2% | 25.8% | 4.8% | 8.1% | 61.3% | 12.9% | |
| Your carpet needs professional cleaning. | 38.7% | 17.7% | 30.6% | 6.5% | 6.5% | 56.5% | 12.9% | |
| Your car needs maintenance. | 35.5% | 25.8% | 25.8% | 4.8% | 8.1% | 61.3% | 12.9% | |
| Your septic system is backing up or needs service. | 33.9% | 21.0% | 33.9% | 4.8% | 6.5% | 54.8% | 11.3% | |
| You are buying or selling a home. | 38.7% | 17.7% | 32.3% | 3.2% | 8.1% | 56.5% | 11.3% | |
| Your windows are old, damaged, or need replacement. | 37.1% | 25.8% | 25.8% | 4.8% | 6.5% | 62.9% | 11.3% | |
| Your siding is damaged and needs repair or replacement. | 35.5% | 27.4% | 25.8% | 4.8% | 6.5% | 62.9% | 11.3% | |
| You need pool cleaning, maintenance, or repair. | 40.3% | 19.4% | 29.0% | 4.8% | 6.5% | 59.7% | 11.3% | |
| Your lawn needs regular care, mowing, or landscaping. | 41.9% | 21.0% | 25.8% | 6.5% | 4.8% | 62.9% | 11.3% | |
| Your driveway, house, or patio needs pressure washing. | 37.1% | 21.0% | 30.6% | 4.8% | 6.5% | 58.1% | 11.3% | |
| You have junk, old furniture, or debris that needs to be removed. | 41.9% | 19.4% | 27.4% | 4.8% | 6.5% | 61.3% | 11.3% | |
| You need a house cleaning service. | 38.7% | 22.6% | 27.4% | 4.8% | 6.5% | 61.3% | 11.3% | |
| You have a tree that needs trimming, removal, or storm cleanup. | 32.3% | 22.6% | 35.5% | 1.6% | 8.1% | 54.8% | 9.7% | |
| Your home has water, fire, or storm damage. | 35.5% | 24.2% | 30.6% | 3.2% | 6.5% | 59.7% | 9.7% | |
| You need catering for a party, meeting, or event. | 46.8% | 22.6% | 21.0% | 4.8% | 4.8% | 69.4% | 9.7% | |
| You need movers. | 41.9% | 19.4% | 29.0% | 4.8% | 4.8% | 61.3% | 9.7% | |
| Your roof is leaking after a storm. | 33.9% | 25.8% | 32.3% | 1.6% | 6.5% | 59.7% | 8.1% | |
| You are looking for a restaurant nearby. | 43.5% | 29.0% | 19.4% | 3.2% | 4.8% | 72.6% | 8.1% | |
| You need water delivery, water treatment, or water service for your home or business. | 41.9% | 27.4% | 22.6% | 3.2% | 4.8% | 69.4% | 8.1% | |
| You need a storage unit. | 45.2% | 19.4% | 27.4% | 1.6% | 6.5% | 64.5% | 8.1% | |
| You have a clogged toilet, broken pipe, or plumbing issue. | 35.5% | 24.2% | 33.9% | 0.0% | 6.5% | 59.7% | 6.5% |
Part 6. The same 47 needs as direct business categories
Q20. “For each industry, choose which tool you would use first when searching.” The same needs reworded as provider categories, sorted from most AI-leaning to least.
| Item | Share of answers | Fully Google | Somewhat Google | Tossup | Somewhat AI | Fully AI | Google total | AI total |
|---|---|---|---|---|---|---|---|---|
| Caterer | 51.6% | 21.0% | 14.5% | 11.3% | 1.6% | 72.6% | 12.9% | |
| Auto repair shop | 54.8% | 17.7% | 14.5% | 8.1% | 4.8% | 72.6% | 12.9% | |
| Mold testing company | 56.5% | 16.1% | 16.1% | 9.7% | 1.6% | 72.6% | 11.3% | |
| Venue for a wedding/event | 56.5% | 16.1% | 16.1% | 8.1% | 3.2% | 72.6% | 11.3% | |
| Financial advisor | 58.1% | 19.4% | 11.3% | 9.7% | 1.6% | 77.4% | 11.3% | |
| Electrician | 53.2% | 21.0% | 14.5% | 4.8% | 6.5% | 74.2% | 11.3% | |
| Landscaping company | 50.0% | 25.8% | 12.9% | 6.5% | 4.8% | 75.8% | 11.3% | |
| Pressure washing company | 53.2% | 22.6% | 12.9% | 8.1% | 3.2% | 75.8% | 11.3% | |
| Junk removal company | 54.8% | 21.0% | 12.9% | 8.1% | 3.2% | 75.8% | 11.3% | |
| Lawyer | 53.2% | 19.4% | 16.1% | 8.1% | 3.2% | 72.6% | 11.3% | |
| Insurance agent | 48.4% | 27.4% | 12.9% | 8.1% | 3.2% | 75.8% | 11.3% | |
| Storage unit/facility | 53.2% | 22.6% | 12.9% | 6.5% | 4.8% | 75.8% | 11.3% | |
| Roofing company | 53.2% | 19.4% | 17.7% | 4.8% | 4.8% | 72.6% | 9.7% | |
| Garage floor coating company | 56.5% | 17.7% | 16.1% | 8.1% | 1.6% | 74.2% | 9.7% | |
| Closet company | 50.0% | 21.0% | 19.4% | 8.1% | 1.6% | 71.0% | 9.7% | |
| Tree service company | 53.2% | 19.4% | 17.7% | 6.5% | 3.2% | 72.6% | 9.7% | |
| Septic service company | 58.1% | 16.1% | 16.1% | 4.8% | 4.8% | 74.2% | 9.7% | |
| Painter | 53.2% | 17.7% | 19.4% | 6.5% | 3.2% | 71.0% | 9.7% | |
| Restoration company | 50.0% | 22.6% | 17.7% | 6.5% | 3.2% | 72.6% | 9.7% | |
| Grading/site contracting company | 51.6% | 19.4% | 19.4% | 6.5% | 3.2% | 71.0% | 9.7% | |
| Dentist | 54.8% | 24.2% | 11.3% | 6.5% | 3.2% | 79.0% | 9.7% | |
| Salon or day spa | 54.8% | 22.6% | 12.9% | 6.5% | 3.2% | 77.4% | 9.7% | |
| Real estate agent | 56.5% | 17.7% | 16.1% | 4.8% | 4.8% | 74.2% | 9.7% | |
| CPA/tax advisor | 51.6% | 21.0% | 17.7% | 6.5% | 3.2% | 72.6% | 9.7% | |
| Moving company | 56.5% | 14.5% | 19.4% | 6.5% | 3.2% | 71.0% | 9.7% | |
| Auto glass repair company | 56.5% | 17.7% | 16.1% | 6.5% | 3.2% | 74.2% | 9.7% | |
| Manufacturing company | 59.7% | 17.7% | 12.9% | 6.5% | 3.2% | 77.4% | 9.7% | |
| HVAC company | 56.5% | 22.6% | 11.3% | 6.5% | 3.2% | 79.0% | 9.7% | |
| Exterminator | 56.5% | 17.7% | 16.1% | 4.8% | 4.8% | 74.2% | 9.7% | |
| Garage door repair company | 54.8% | 21.0% | 14.5% | 6.5% | 3.2% | 75.8% | 9.7% | |
| Concrete company/contractor | 59.7% | 16.1% | 14.5% | 4.8% | 4.8% | 75.8% | 9.7% | |
| Fence company | 54.8% | 22.6% | 12.9% | 6.5% | 3.2% | 77.4% | 9.7% | |
| Window company | 54.8% | 21.0% | 14.5% | 6.5% | 3.2% | 75.8% | 9.7% | |
| Siding company | 61.3% | 16.1% | 12.9% | 8.1% | 1.6% | 77.4% | 9.7% | |
| Gutter company | 58.1% | 19.4% | 12.9% | 8.1% | 1.6% | 77.4% | 9.7% | |
| Pool service | 56.5% | 17.7% | 16.1% | 4.8% | 4.8% | 74.2% | 9.7% | |
| Appliance repair company | 54.8% | 19.4% | 16.1% | 8.1% | 1.6% | 74.2% | 9.7% | |
| Chiropractor | 59.7% | 19.4% | 11.3% | 6.5% | 3.2% | 79.0% | 9.7% | |
| Veterinarian | 56.5% | 21.0% | 12.9% | 6.5% | 3.2% | 77.4% | 9.7% | |
| Plumber | 50.0% | 24.2% | 17.7% | 4.8% | 3.2% | 74.2% | 8.1% | |
| Cleaning company | 54.8% | 17.7% | 19.4% | 6.5% | 1.6% | 72.6% | 8.1% | |
| Med spa | 58.1% | 19.4% | 14.5% | 3.2% | 4.8% | 77.4% | 8.1% | |
| Carpet cleaning company | 53.2% | 22.6% | 16.1% | 4.8% | 3.2% | 75.8% | 8.1% | |
| House cleaner | 51.6% | 22.6% | 17.7% | 4.8% | 3.2% | 74.2% | 8.1% | |
| Locksmith | 58.1% | 21.0% | 12.9% | 3.2% | 4.8% | 79.0% | 8.1% | |
| Funeral home | 61.3% | 16.1% | 14.5% | 6.5% | 1.6% | 77.4% | 8.1% | |
| Pizza restaurant | 59.7% | 14.5% | 21.0% | 3.2% | 1.6% | 74.2% | 4.8% |
Source: CraigAds West Georgia AI Search Habits Survey, 2026 (n = 62). Raw responses on file with CraigAds; individual responses are confidential per the consent agreement. Photos licensed via Adobe Stock; the Carroll County Courthouse photo is licensed for editorial use.

Craig McIlvain
Craig McIlvain is the owner of CraigAds, a collaborative digital marketing agency in Carrollton, Georgia that helps local businesses, franchises, and home-service companies get found and get chosen. With a master’s in applied psychology from USC and more than 2,000 local businesses served, Craig built his approach around one idea: people don’t decide based on information — they decide based on how something makes them feel. He works alongside clients rather than hiding behind dashboards, and he writes about local advertising, SEO, and the real reason customers pick one business over another. At home, he plays guitar and makes electronic music — and gets outvoted by his wife Julia and their kids on which Disney movie they’re watching next.